Exercise with Iris dataset

Developing Data Products Course Project

Juan Carlos Llorente
Coursera student

Introduction

str(iris)
## 'data.frame':    150 obs. of  5 variables:
##  $ Sepal.Length: num  5.1 4.9 4.7 4.6 5 5.4 4.6 5 4.4 4.9 ...
##  $ Sepal.Width : num  3.5 3 3.2 3.1 3.6 3.9 3.4 3.4 2.9 3.1 ...
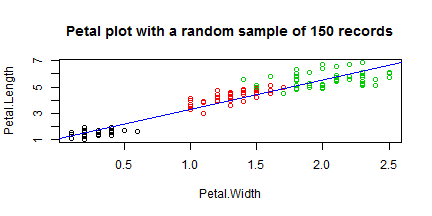
##  $ Petal.Length: num  1.4 1.4 1.3 1.5 1.4 1.7 1.4 1.5 1.4 1.5 ...
##  $ Petal.Width : num  0.2 0.2 0.2 0.2 0.2 0.4 0.3 0.2 0.2 0.1 ...
##  $ Species     : Factor w/ 3 levels "setosa","versicolor",..: 1 1 1 1 1 1 1 1 1 1 ...
  • Aim pursued other than learning is to test the correlation and linear regression fit among 2 pairs of predictors, length and width of either sepal and petal.

THANKS FOR YOUR ATTENTION!

User interface: inputs

All input data is collected from left sidebar panel, including:

  1. Radio button to select variable pair: Sepal or Petal.
  2. Slider to select size of random sample of data to use: from 15 to 150 records.
  3. Checkboxes to request optional summary data, any of the following:
    • correlation factor among variables selected, and
    • intercept, beta coefficient, residual standard error (sigma) and multiple R-squared of the corresponding linear regression fit.
  4. Numeric input box and action button for final surprise.

Main output is displayed since start, aiming to ease the use and evaluation of the application and avoid the need of any deep prerequisite knowledge.

User interface: outputs

Outputs shown in the right main panel include: plot of chunk plot

  1. A dynamic X-Y plot like the one attached (R code with echo=F) showing:
    • The value of the random set of variables selected, coloured by the value of Species.
    • Dynamic title and axis labels corresponding to inputs selected.
    • Computed linear regression fit a as blue line.
  2. Rounded values of the optional summary data requested, if any.
  3. A final surprise text if the action button has been pressed once.

Server.R

Server application includes these elements:

  1. Initialization and defaulting of all input variables.
  2. Use of reactive function to enhance performance, computing the following intermediate variables:
    • Vector with sample row numbers to be processed, with the size selected (spv variable).
    • Columns corresponding to variables to be plotted (col variable).
    • Corresponding linear regression fit (fit variable).
  3. Render of X-Y plot with all components:
    • The variable values, coloured by the respective value of Species,
    • Corresponding X-axis and Y-axis labels and resulting main title.
    • Linear regression fit line, in blue colour.
  4. Render print of optional summary data, pasted from a character vector containing all magnitude texts.
  5. Processing of Go button, and output of final surprise text if pressed.